
Chemical Facility
October 14, 2025
Chemical Facility: Industrial site feasibility report.

Chemical Facility: Industrial Site Feasibility Report
Site and Targets
The Industrial Site modelled has an average demand for electricity of 250kW and 270kW of heat. This creates a total demand for energy per annum of 4.5GWh, this produces 931 tonnes of CO2e emissions in their Scope 1 & 2 emissions.
The site wants an energy system that reduces their reliance on the grid, is financially viable over 15 years and reduces the CO2e emissions by 75%. Energy resiliency would protect against power cuts and variable pricing.
Executive Summary
This Industrial Site achieved a significant decarbonisation while maintaining a positive economic impact on the company. The project may not be the highest yield investment for this site when only considering cashflow however reducing the vulnerability to grid price volatility, carbon trading schemes and being able to run the site if the grid failed could have major upsides not seen on the financials.
This feasibility study shows that investment into an energy plan is worth considering. The results given in this report detail one scenario, running sensitivity studies on variations of the technical and financial parameters is quick and easy now the feasibility is finished. This includes testing the impact of different equipment sizes, determining the best financing options, and increasing the accuracy of the model using exact quotes and values from suppliers.
This feasibility study was done within a day and was later expanded to a full finance ready application. Encast later provided consultants to model up to the finance ready level required.
Site Demand
The Site demand for Heat and Electricity look similar, using Encast an overview is made for any demand data uploaded. This also summarises the health of the data being uploaded to prevent inaccuracies being present in the model. Below is a breakdown of the electrical demand:
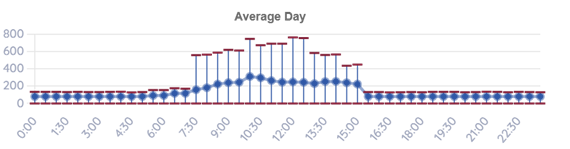
On the graph above, Averages are in blue, and extremes are in red for each half hour of a 24hour period.
From the visualisation, we can see that the peak demand is near 800kWh in a half hour, this translates to a 1.6MW demand for electricity. This site’s demand is mainly seen between 8am and 4pm on weekdays, the site has a ramp down on Saturdays and is inactive on Sundays.
Installation Plan
To achieve the site’s goals, there are 6 phases of installations. These aim to increase the availability of electrical energy and then provide heat using the available low carbon electricity.

The stages of increased production of electricity means that the factory does not become particularly vulnerable to a major infrastructure change in one go and capital expenditure can be spread across the 7-year period.
The system in 2032 is desired in day 1, however delaying technologies such as Battery Energy Storage Systems (BESS) and Air Source Heat Pumps (ASHP) gives time for the prices to reduce while supporting infrastructures and technologies become more abundant.
Project Visualisations: Annual
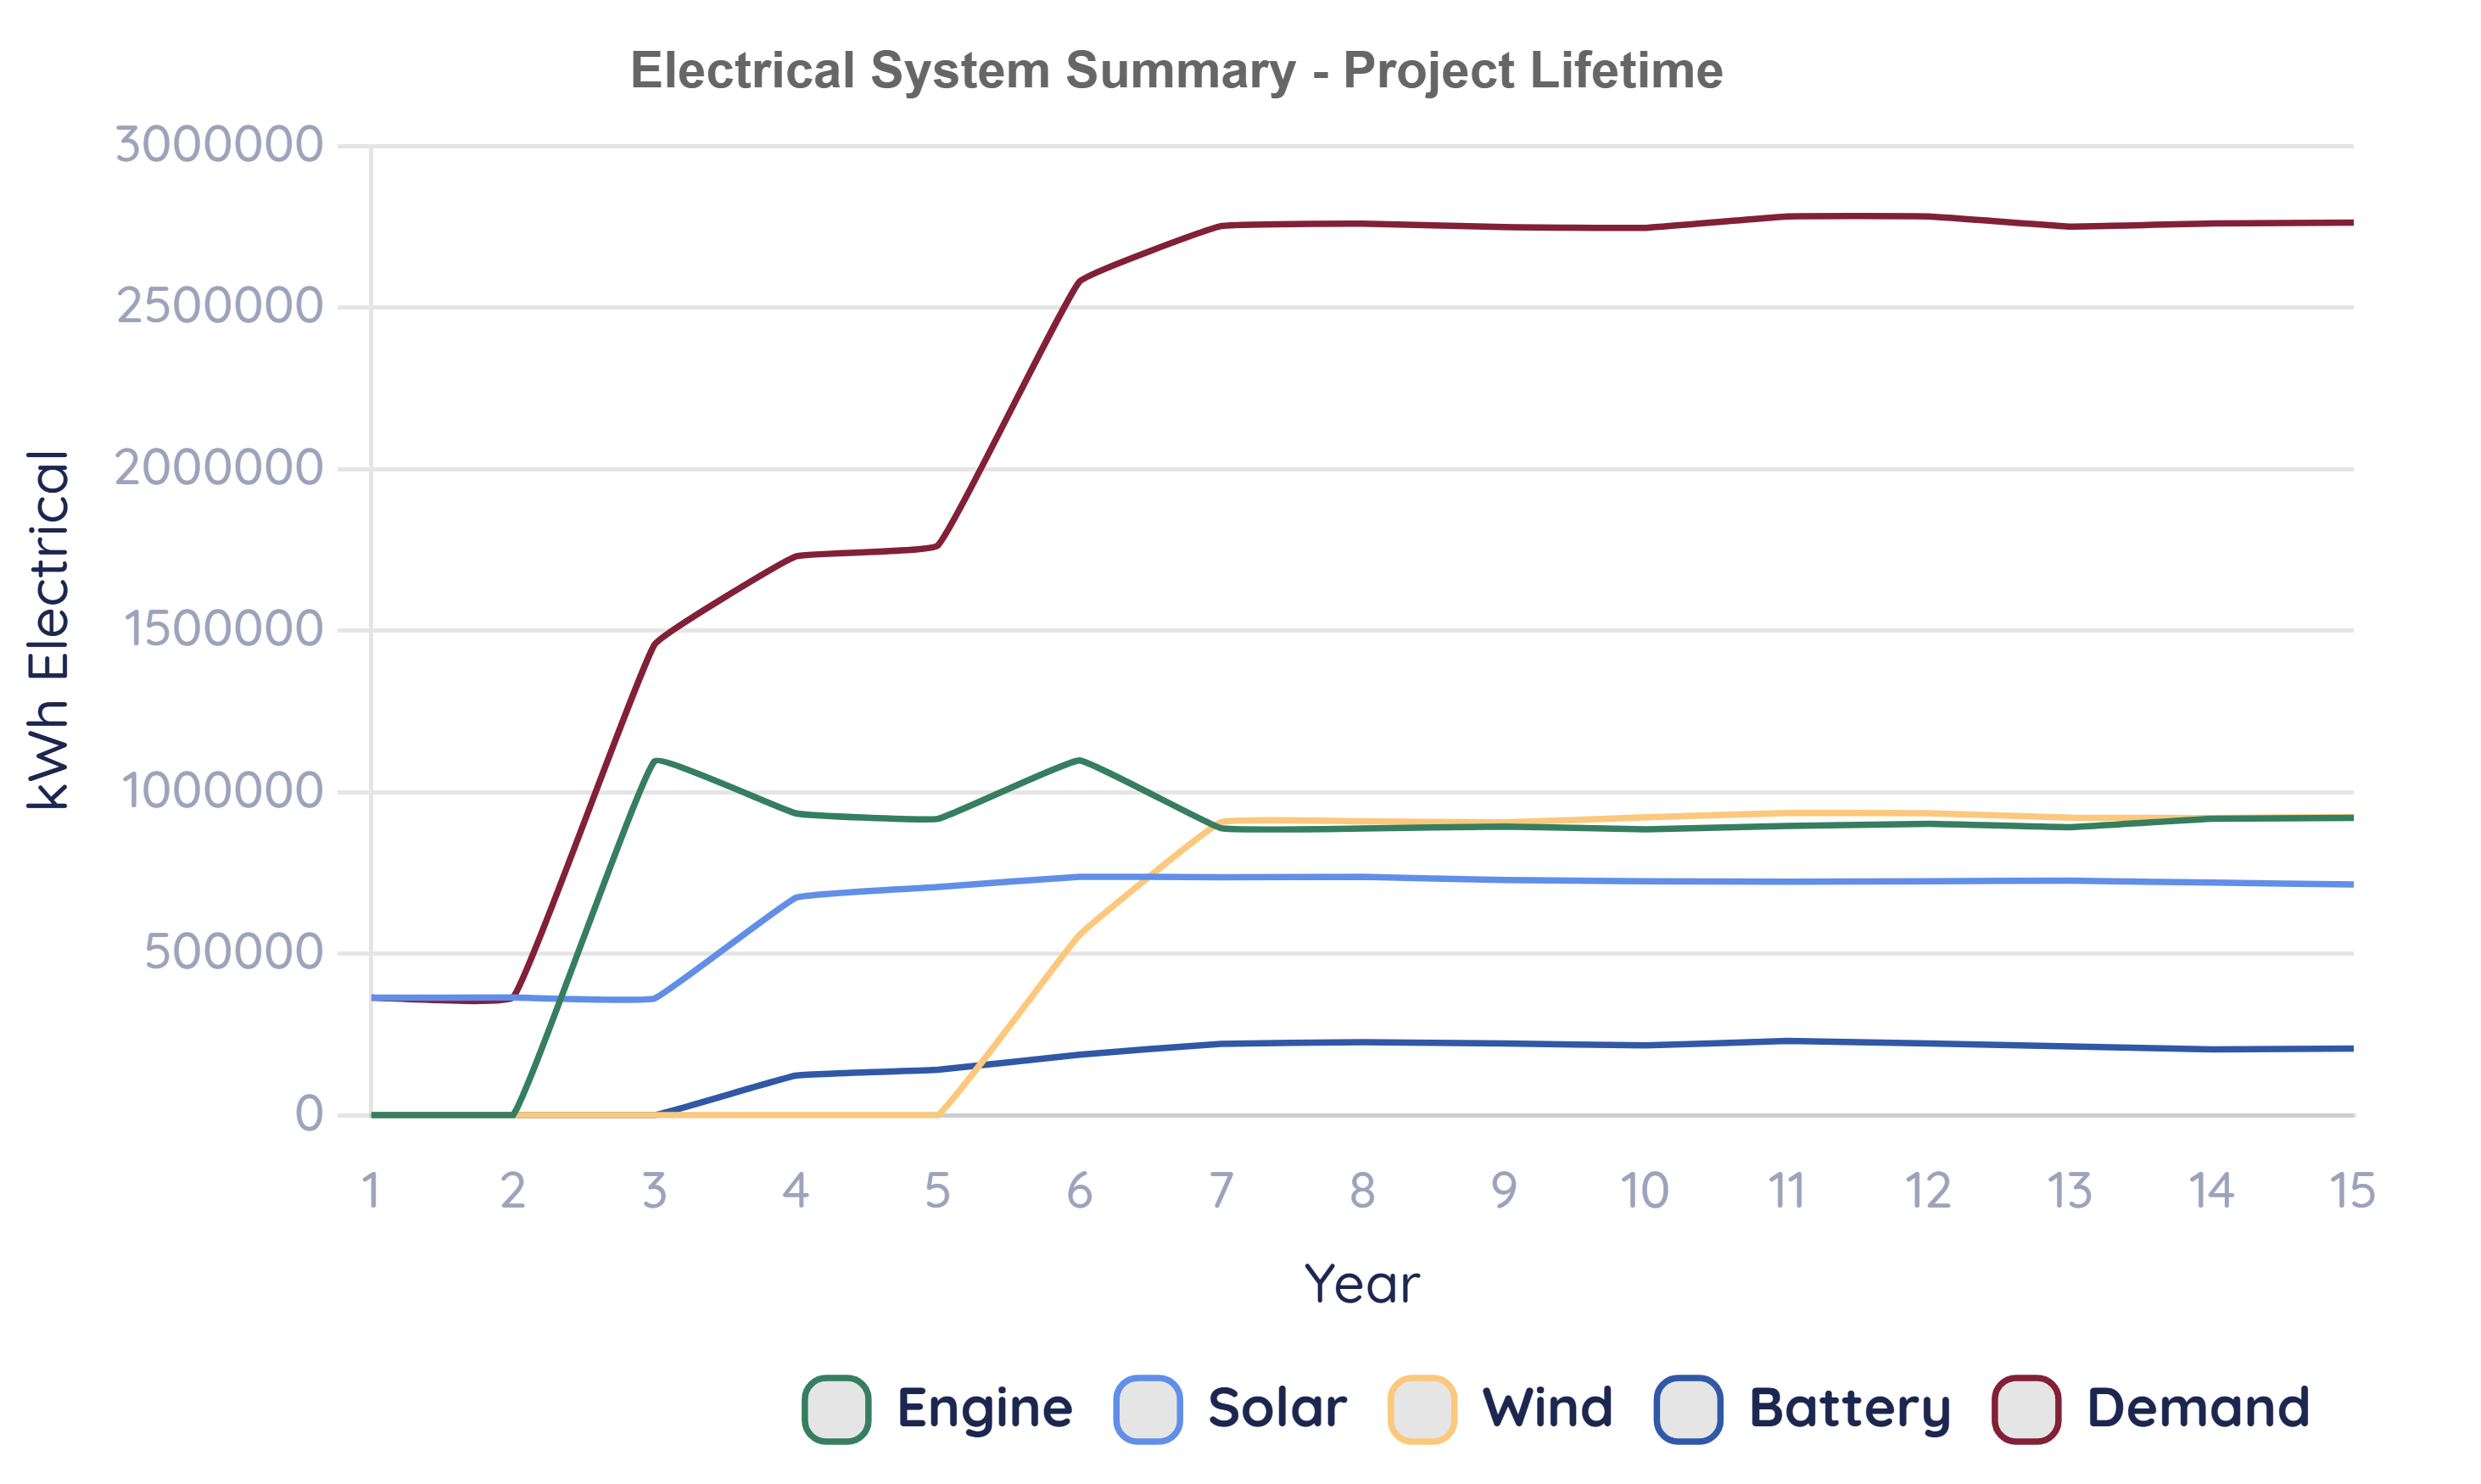
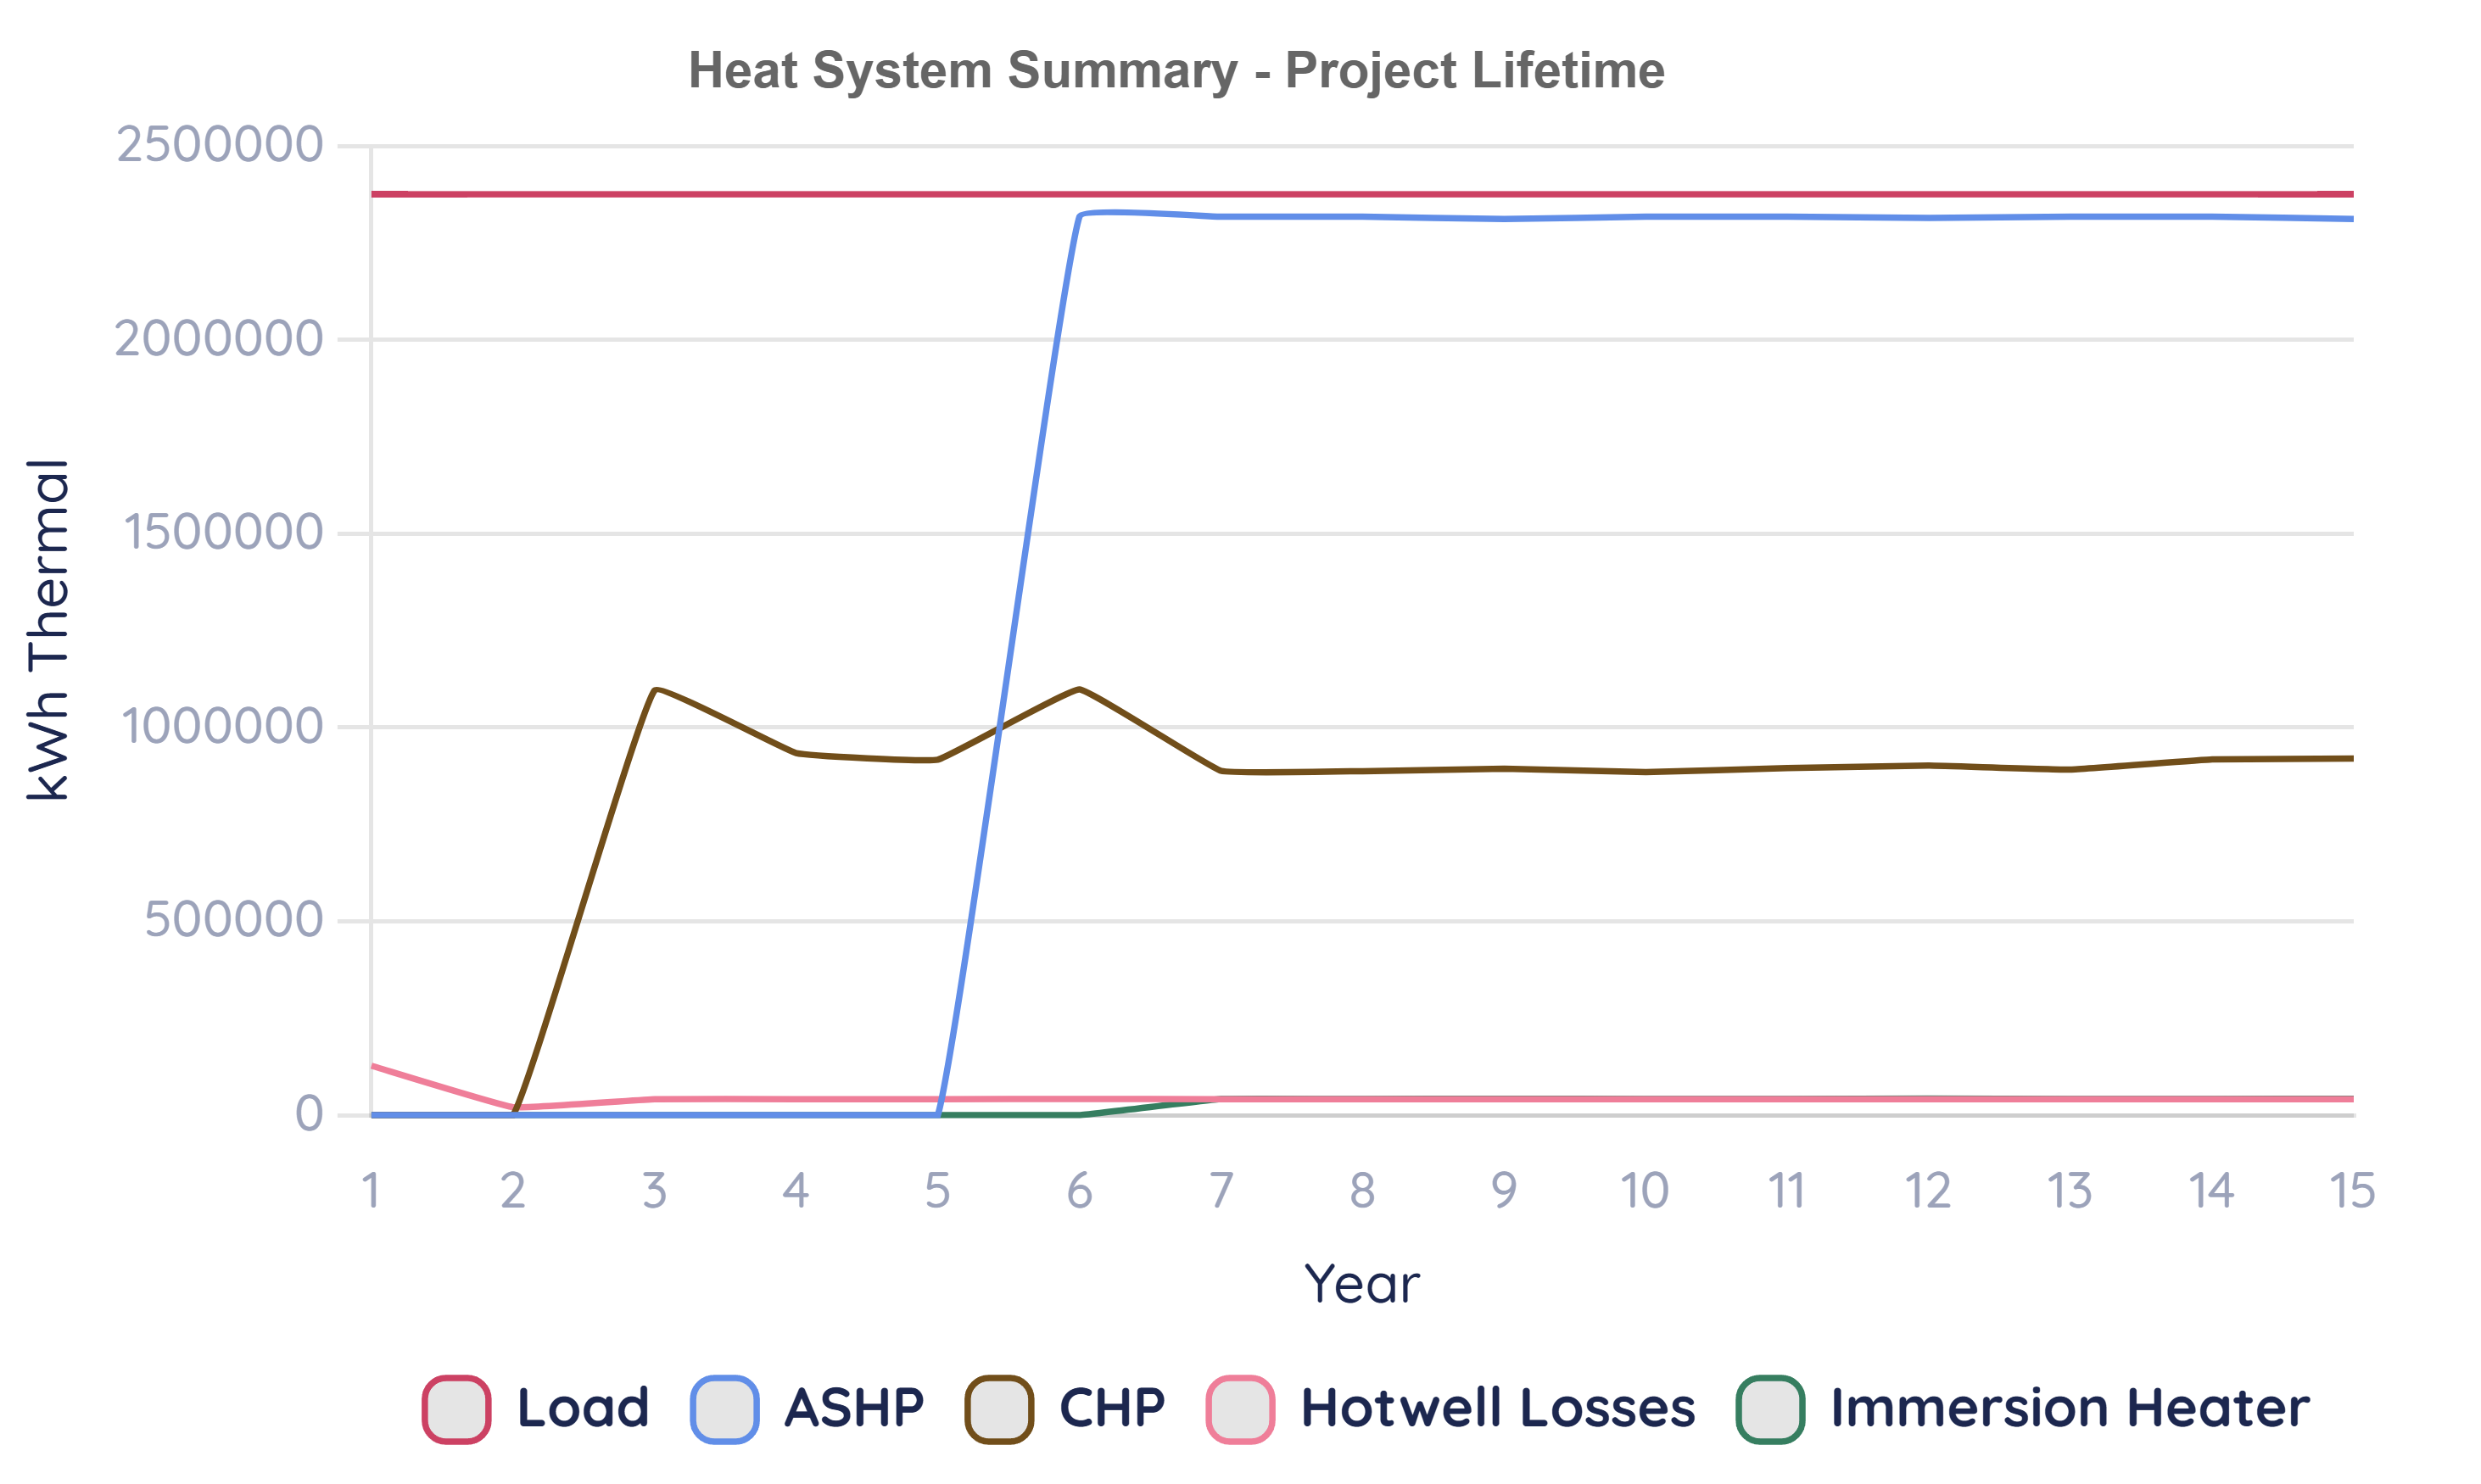
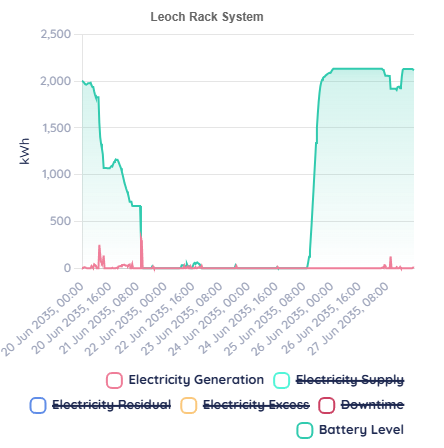
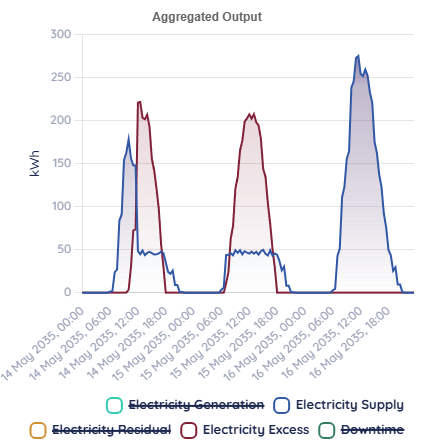
Project lifetime summaries give an overview of how the phased implementation of equipment reduces the reliance on Grid energy and Gas. Year 7 on these graphs is equivalent to 2032 on the implementation plan, at this point the grid usage has fallen, and demand increases as energy is supplied to the ASHP. After year 7, Heating is supplied with no gas usage and predominantly provided by the air source heat pump.
Project Visualisations: Daily
.png)
.png)

.png)
The graphs above compare 2025 and 2035 for this site, the demand of the site is given in Red, the data is shown as kWh/day. There is a Moving average filter added to the yearly graphs except from the Year 1 electrical, this is due to the variations seen between days, without smoothing the graphs become illegible.
The mixture of energy produced on site, stacked against the demand of the site shows that the requirement is nearly completely fulfilled by the installed equipment.
The comparison of the heat systems shows that there is no longer any gas use on the site, instead the heating comes from the CHP and renewable electricity, when stacked together, match the demand for heat. The amount of heat lost in the system reduces considerably due to insulation being added to the heat storage.
Project Visualisations: Half-Hour
Encast allows users to see the energy system on a half hourly basis, giving transparency of our method.
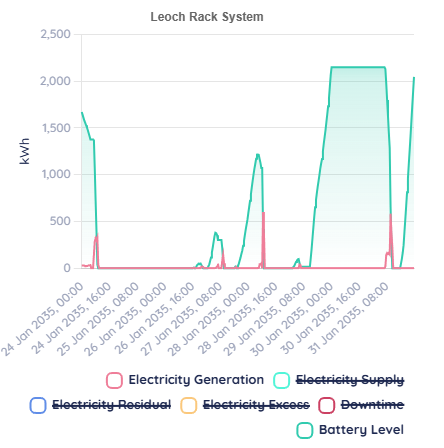
Between summer and Winter, the Battery usage is similar, this means that the wind and solar systems are balanced relatively well across the year. Half hourly views of the model give insights into the functionality of the site. We can see that the battery is not being used to it’s full capacity in the week, this gives opportunities for sensitivity studies where the battery is used to purchase low cost overnight energy and use it in the day.
Looking at the Solar output across 3 days of the model, we can see that the demand of the site changes dramatically between weekends and work days, this means that the solar arrays are exporting 400kW (200kWh per half hour) in the middle of the weekends, but all of the energy is used by the site in the working week.
Financial Report
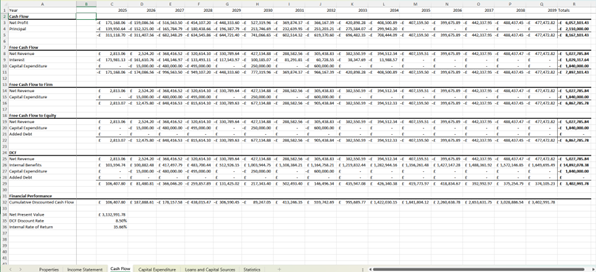
Encast gives an easily navigated summary of the cash flows for a project. This can be done for each year of the project, or each month to see the profitability change with the time of year.

This breakdown makes it easy to find the biggest factors for profitability in the model. Changing between scenarios is 2 clicks, so you can quickly compare sensitivity studies.
At the top of the reports page, you can click Download Excel and instantly have a clearly formatted financial breakdown that can be shared with others who aren’t logged in to Encast.
Project Visualisations: Annual
Project lifetime summaries give an overview of how the phased implementation of equipment reduces the reliance on Grid energy and Gas. Year 7 on these graphs is equivalent to 2032 on the implementation plan, at this point the grid usage has fallen, and demand increases as energy is supplied to the ASHP. After year 7, Heating is supplied with no gas usage and predominantly provided by the air source heat pump.
Financial Visualisations
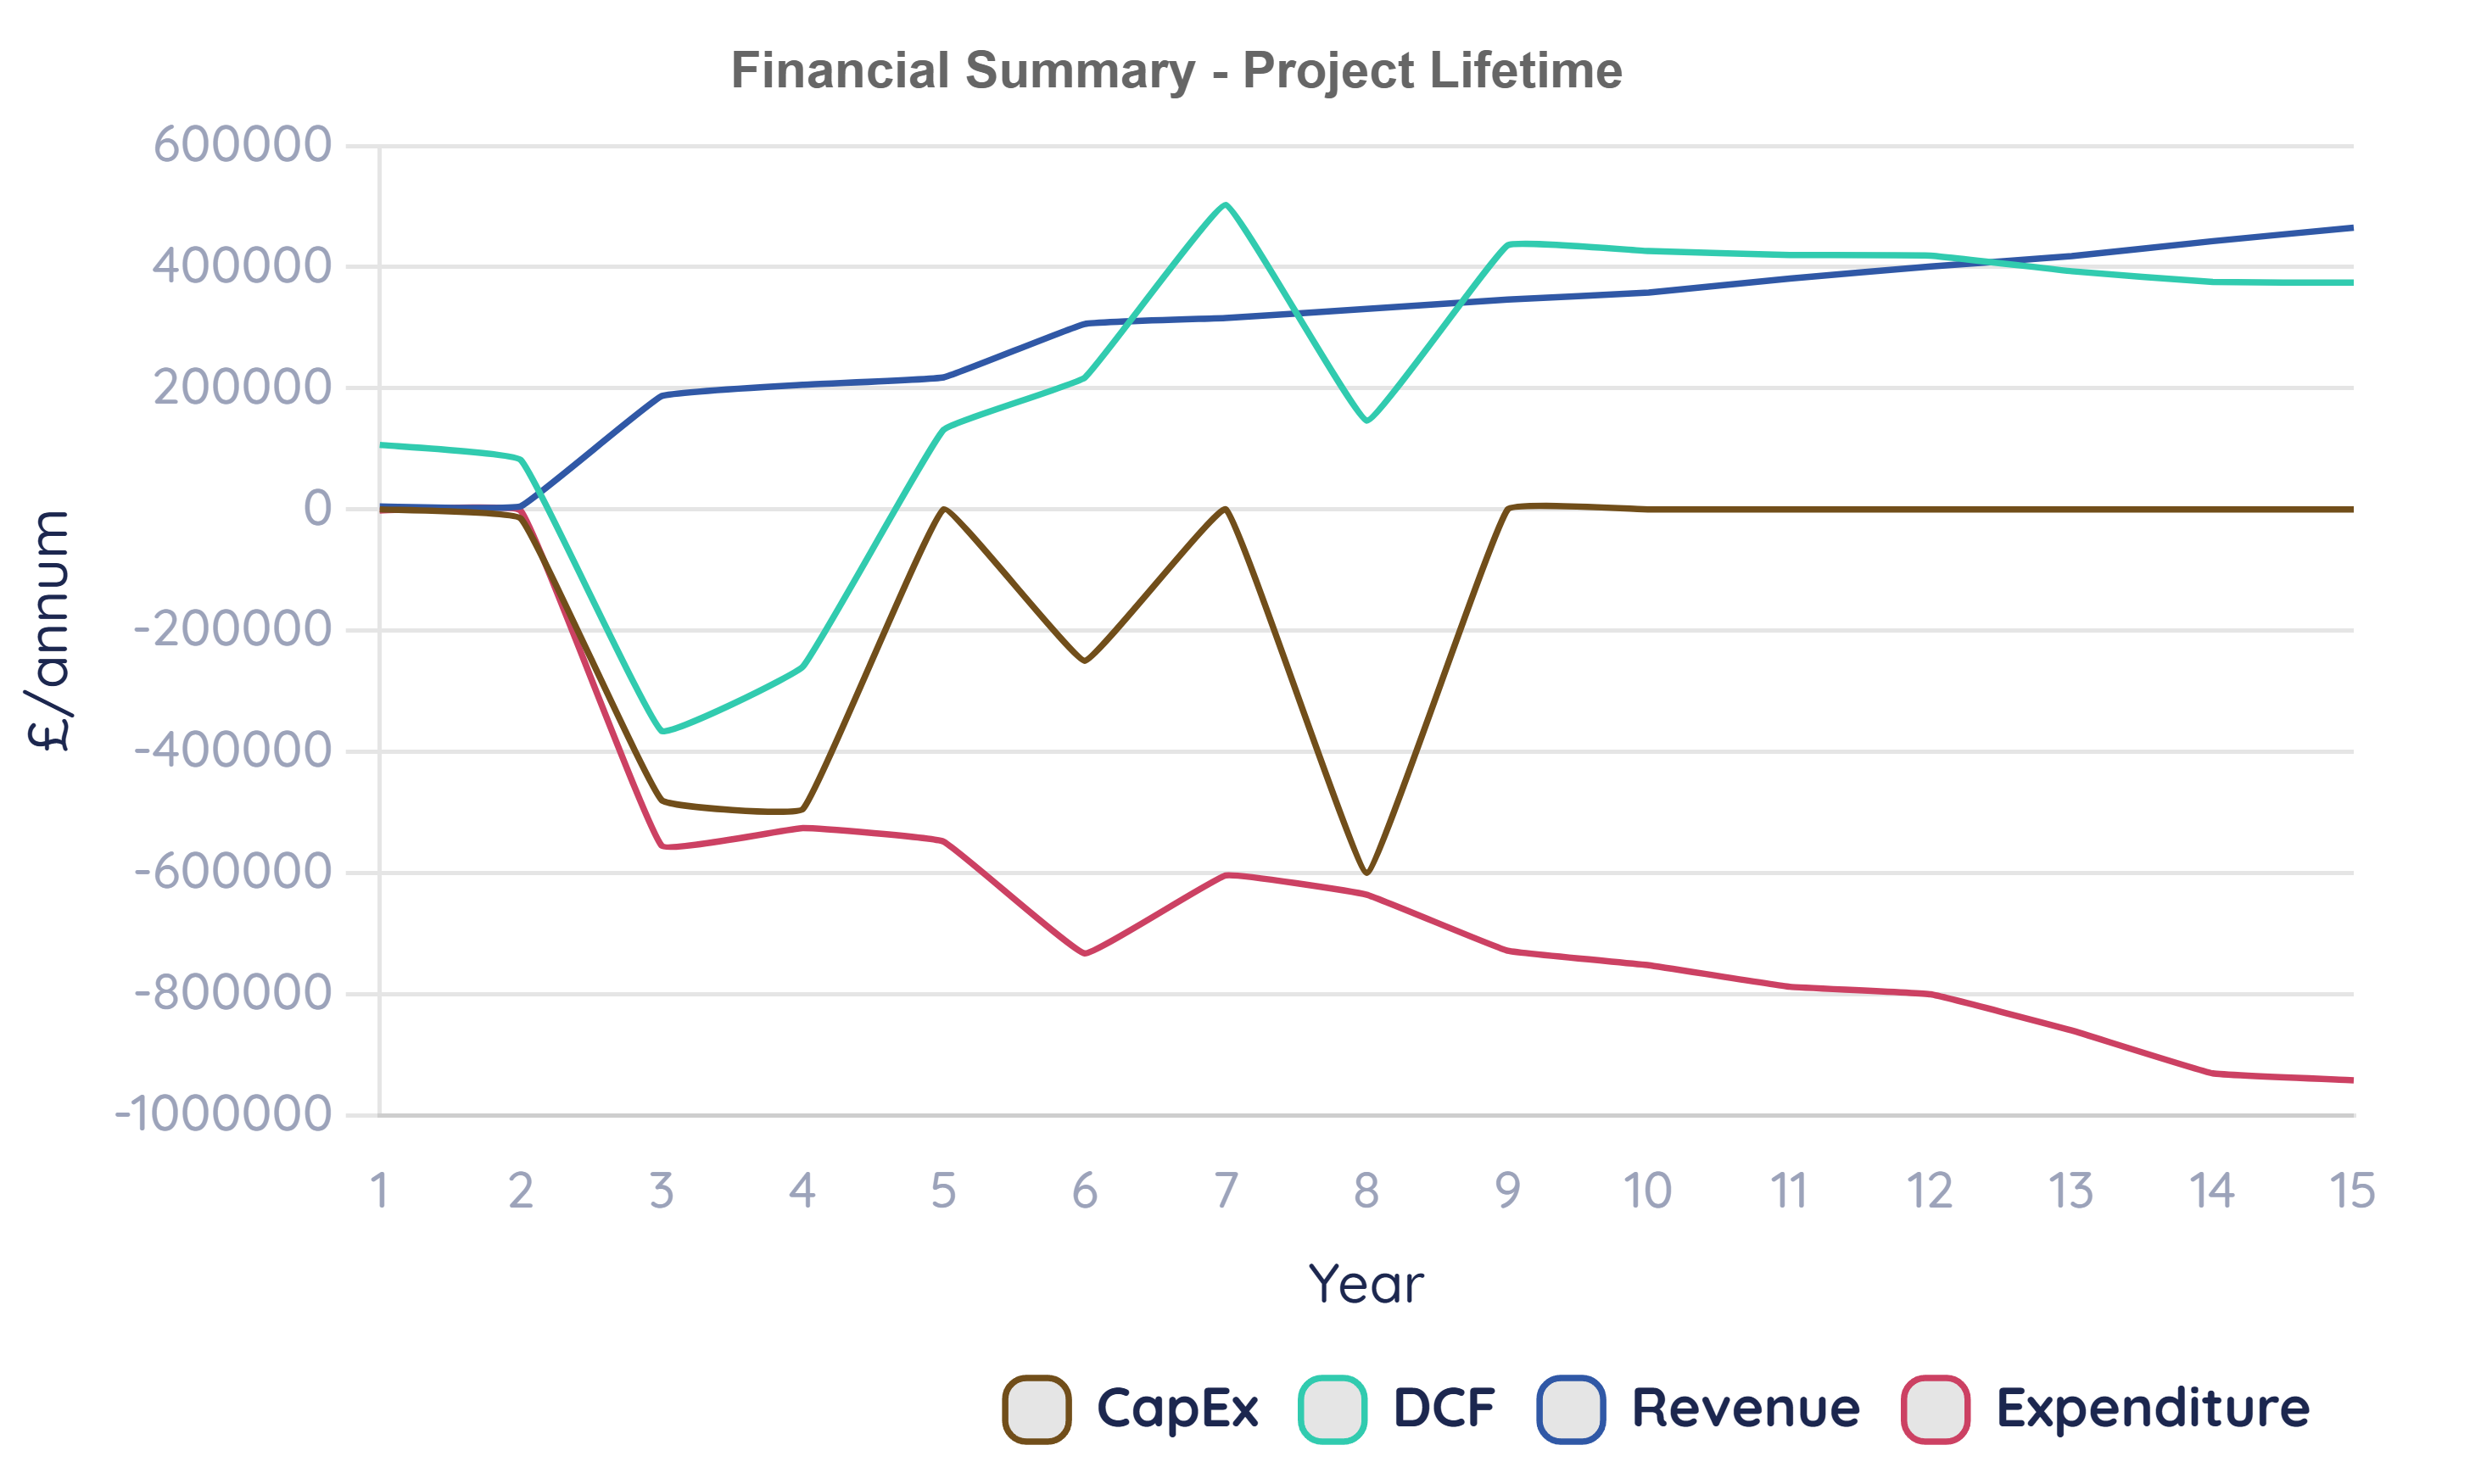
The financial summary graph shows how phased build out balances the capital expenditure across the years, using the initial investment spread across a 7-year timeline. The Expenditure outweighs return however Discounted Cash Flow (DCF) is positive from the reduced spending on electricity by the site, this internal benefit isn’t a taxable revenue.
Carbon Report
From the changing of energy sources, Scope 1 and 2 carbon projections for energy can be made. This integrates with business processes to identify how you will be able to reach government or company targets for reducing carbon emissions.
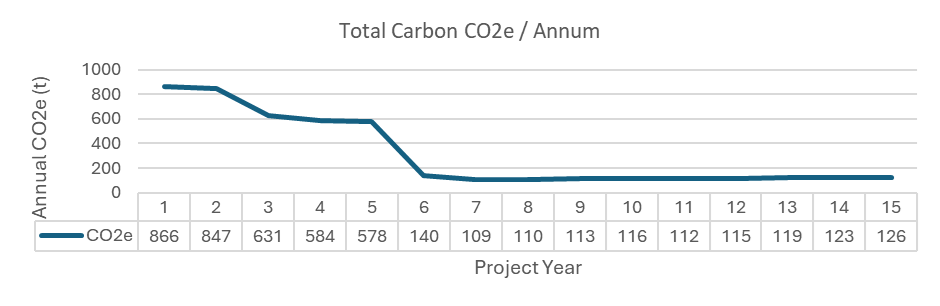
For this project, the annual CO2e emissions reduce from 866 tonnes in year 1, down to 109 tonnes in year 7. The emissions then rise due to Solar and Battery degradation over time however only reaching 126 tonnes, under 15% of the initial CO2e production.
The UK government forecast for market traded carbon values puts CO2e cost at £128/tonnes in 2040, reducing by 740 tonnes/year equates to a saving of £94,720/annum in Carbon market value in 2040.
Ready to build models in real-time?