Encast is a multi-technology energy modelling tool that is specifically designed to build the balance between energy resilience and financial capacity. Acting as a digital twin before you are shovel ready. We are a reliable tool to verify real-world performance, using peer reviewed accuracy. Our goal is to lower the time and resources required to manage energy costs and reliability to make it accessible to everyone.


Every single 30 minute frame is calculated procedurally, using a peer-reviewed physics based approach, allowing effects from conditional operation and externalities such as weather and energy prices to be fully seen and understood. Models can be built for over 30 years in real-time.
Unlimited scenarios to quickly compare performance requirements.
Multi-currency operation to ensure your financial model is accurate.
Alter your energy-generation modules for difference scenarios.
Set your model life, commissioning date and reporting detail.
Incomer and export sizing to build-in capacity constraints.
Value maps are used to define tariffs, electrical & heat demand loads. Every value map uploaded has a statistics page to assess data quality and characteristics. This gives a value of dataset health and heat map to ensure more accurate calculations.
Electrical loads to define the energy required in kWh by the site.
Profit and Loss define a detailed cost or multiplier for a report.
Thermal loads to define the heat used in kWh.
Complex map creation for every 30 minutes of the entire model.
Manually generate your load profile or upload to the platform.

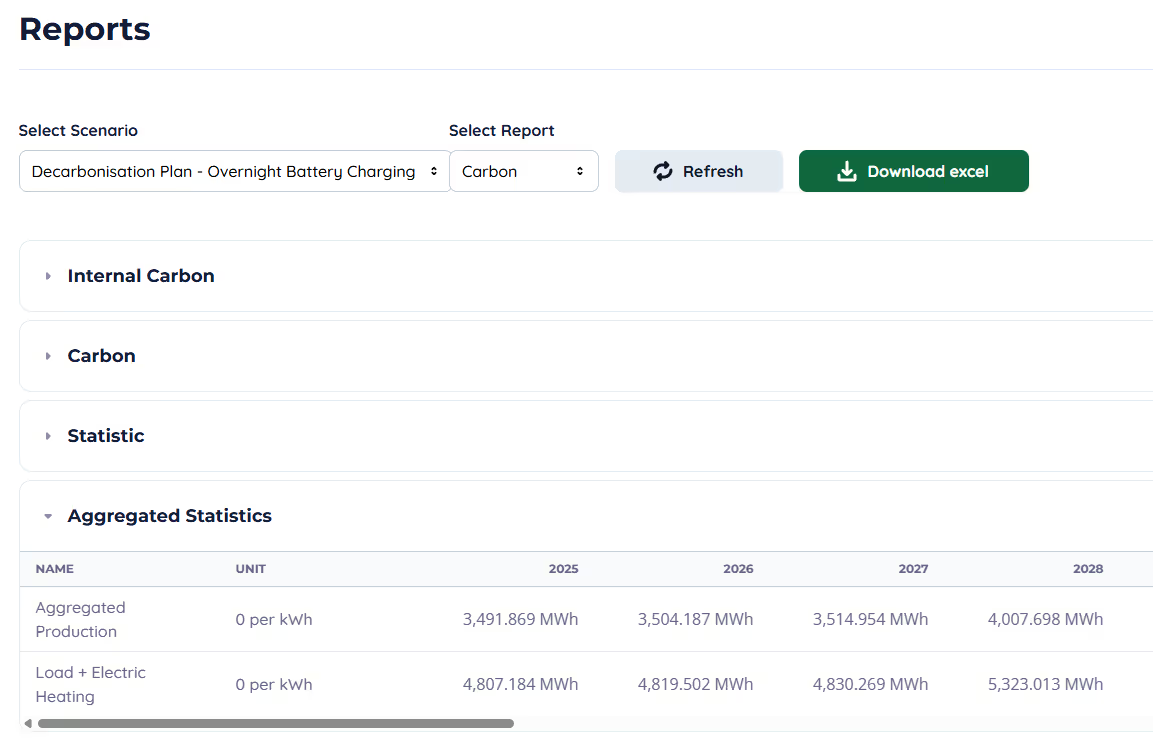
Reporting granularity can be used to switch between yearly and monthly reporting for project life with editable units for energy and mass. If you do not need to see a total value for each statistic, you can turn this on or off with a simple selection.
4 Reporting Areas: Financial, Carbon, Levelised Cost, Downtime.
Summary financial reports for a single look project assessment.
NPV, IRR, Cashflows, Income, Expenditure and TAX calculations.
Display all Levelised Cost of Energy (LCoE) entries for each scenario.
Carbon Report profit & loss entries can be viewed here.
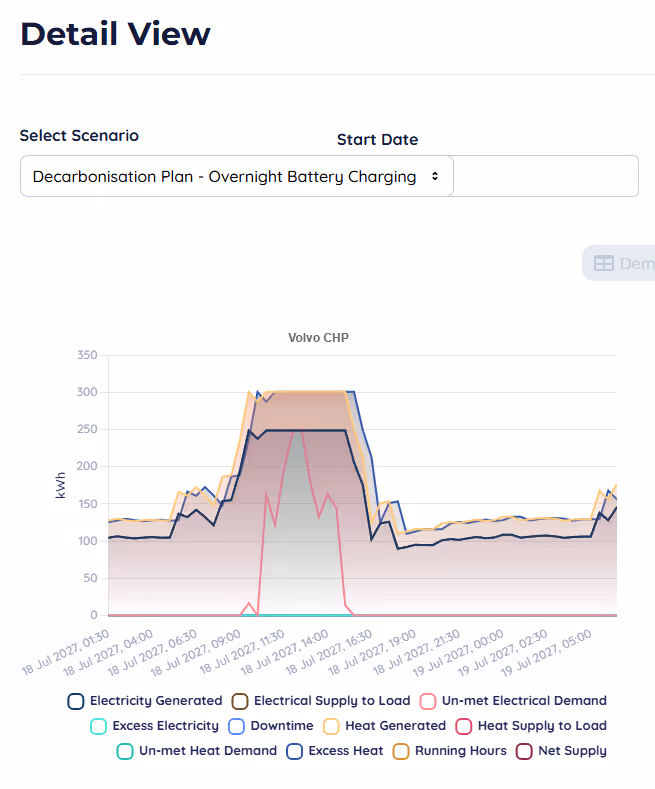
Our detail viewing system allows you to individually inspect the state and performance of every component of an energy solution down to every half hour (at standard frame length) across the project life. Allowing the effects from conditional operation and externalities, such as energy prices and weather, to be understood. Enterprise users may model on shorter frames to increase fidelity. For total project performance analysis.
Performance inspection of every module.
Any period of 28 days or less for every installation.
Select scenario and view each module, demand and headless.
Module panes only if active installations in selected period.
Aggregated chart if multiple installations in module.
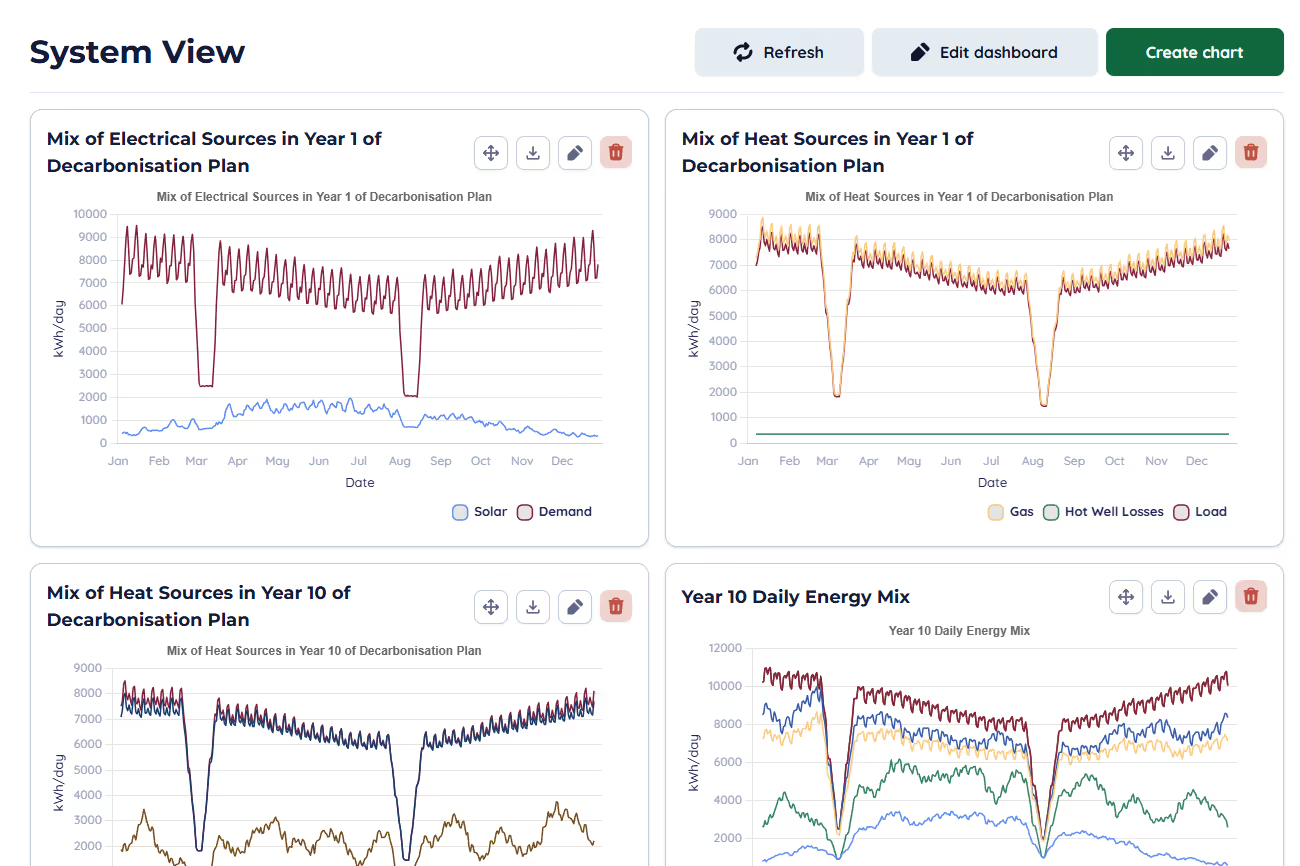
Visualising your modelling forecast in dashboards allow you to compare the different elements together. You have control over the chart type, what is presented and how. You may create multiple dashboards for a project comparing scenarios.
Breakdown by energy module type or each installation instance.
Profit & loss for all variable and value maps across the project.
Financial analysis in detail for all key analysis metrics.
Aggreged production or separate load and heating output.
Stack data, format display, axis and series ordering.
Our proprietary modelling engine allows you to model down to 2-minute intervals across decades with no compromise on modelling speed. This allows sophisticated modelling of operation and maintenance dynamics.
Zoom down to two-minute resolution for precise insights.
Debug equipment cycling, dispatch, and control rule triggers.
Match simulation resolution to your actual system dynamics.
Prove whether higher resolution changes your conclusions.
Capture fast operational behaviour that other models miss.